I recently rebuilt my monitoring environment for the servers I manage. In this post I describe what technologies I chose and how they fit together to form a monitoring stack that - once set up – gives you quick access to relevant metrics and logs and doesn’t burden you much with operations.
A couple of requirements were important for me:
- Everything should be self-hosted and I wanted a central monitoring server which collects data from all monitored hosts
- Since most servers I manage are internal and not reachable from the outside, pushing metrics and logs is more practical than pulling (partially allowed outbound access is a given). Pushing also skips maintaining a list of servers on the monitoring host.
- Distributing collectors to the servers to be monitored should be easy
- Servers should authenticate to push logs and metrics and it should be easy for me to onboard new servers or revoke access. There should only be a limited amount of management overhead to manage credentials/PKI on my side
- Monitoring dashboards and exploratory tools for logs need only be accessible for me without much compartmentalization but should obviously also be properly protected
- When certain metrics go out of normal range or relevant errors pop up I should get alerts. The notifications should arrive as emails in my mailbox and as notifications on my phone (iOS).
I operate at a relatively small scale, so keep this in mind :-)
Tools
The tools I chose to achieve all of these requirements were the following.
- Terraform
- For initial provisioning of the monitoring host including storage
- Ansible
- For setting up and manage the monitoring host (e.g. setting up the whole tech stack below, deploying configs and alerting rules, deploying new customer certificate bundles, etc.)
- For distributing the monitoring agent to the hosts to be monitored (set some variables, run playbook, done)
- Prometheus
- For collecting metrics from the monitored hosts
- I enabled
remote-write-receiverto have an endpoint to which metrics can be pushed
- Node Exporter
- Installed on the monitoring server itself to get internal metrics
- Alertmanager
- For sending emails and webhook notifications based on alert rules
- ntfy
- Accepting alerts from Alertmanager and giving me push notifications on my phone
- Two customizations were needed: 1) I actually send the alerts first to a custom Python script (alertmanager-ntfy-adapter in diagram below) to format them nicely and then forward them to ntfy. 2) To make instant push notifications work on iOS I unfortunately needed to enable the ntfy upstream server – the message contents stay local though (explanation).
- Loki
- For collecting the log data of the monitored hosts (logs are pushed, just like metrics)
- Grafana
- For visualizing Prometheus metrics
- For easy exploration of Loki log data
- Alloy
- The agent running on the monitored hosts to collect local metrics and logs and push them to the monitoring server
- Includes
node_exporter'scollectors via theprometheus.exporter.unixcomponent to collect relevant OS and hardware metrics
- Nginx
- Proxying all external requests (pushed logs to Loki, pushed metrics to Prometheus)
- Handling authentication of the requests via client certificates (mutual TLS). This means no additional software to install on the clients, simple per-customer revocation, no additional network requirements (e.g. outbound UDP for VPN)
- Proxying ntfy (to be externally available for the iPhone client)
- Certbot
- Handling server certificates for nginx
- WireGuard
- For giving me access to the monitoring host – mostly to look at Grafana
- allgood.systems (my own tool)
- For sending regular heartbeats and have a separate system watch over them (in case the monitoring server itself goes down)
Architecture
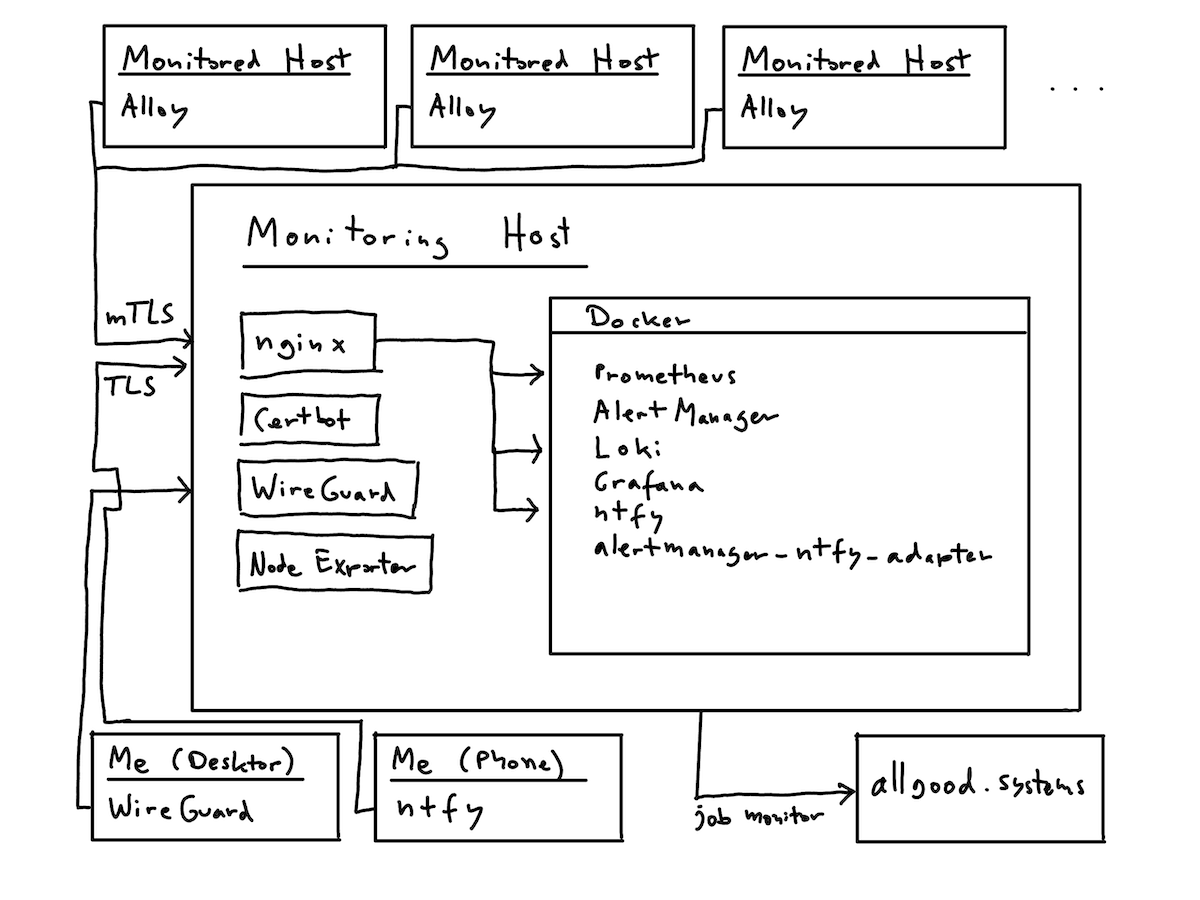
On the monitoring server I decided to run Nginx (the entry point for all collected data), Certbot and WireGuard directly on the host and the rest of the tools as Docker containers.
The architecture looks something like this:
Workflow
The nice thing about having everything codified in ansible and using mTLS is that it’s easy to onboard a new server/customer:
- Generate a new client certificate and key for the customer
- Regenerate the client certificate bundle to be deployed to the monitoring server (this is what nginx validates against for Prometheus and Loki endpoints)
- Configure a few
host_varsand/orgroup_varsfor the customer’s ansible setup (essentially defining what logs to collect, what units to monitor, what labels to use, etc.) - Run playbook for monitoring server (to deploy certificate bundle)
- Run playbook for host to be monitored (to deploy alloy)
- See metrics and logs flowing in
And to revoke access, I can just remove the client certificate from the bundle and deploy again.
Screenshots
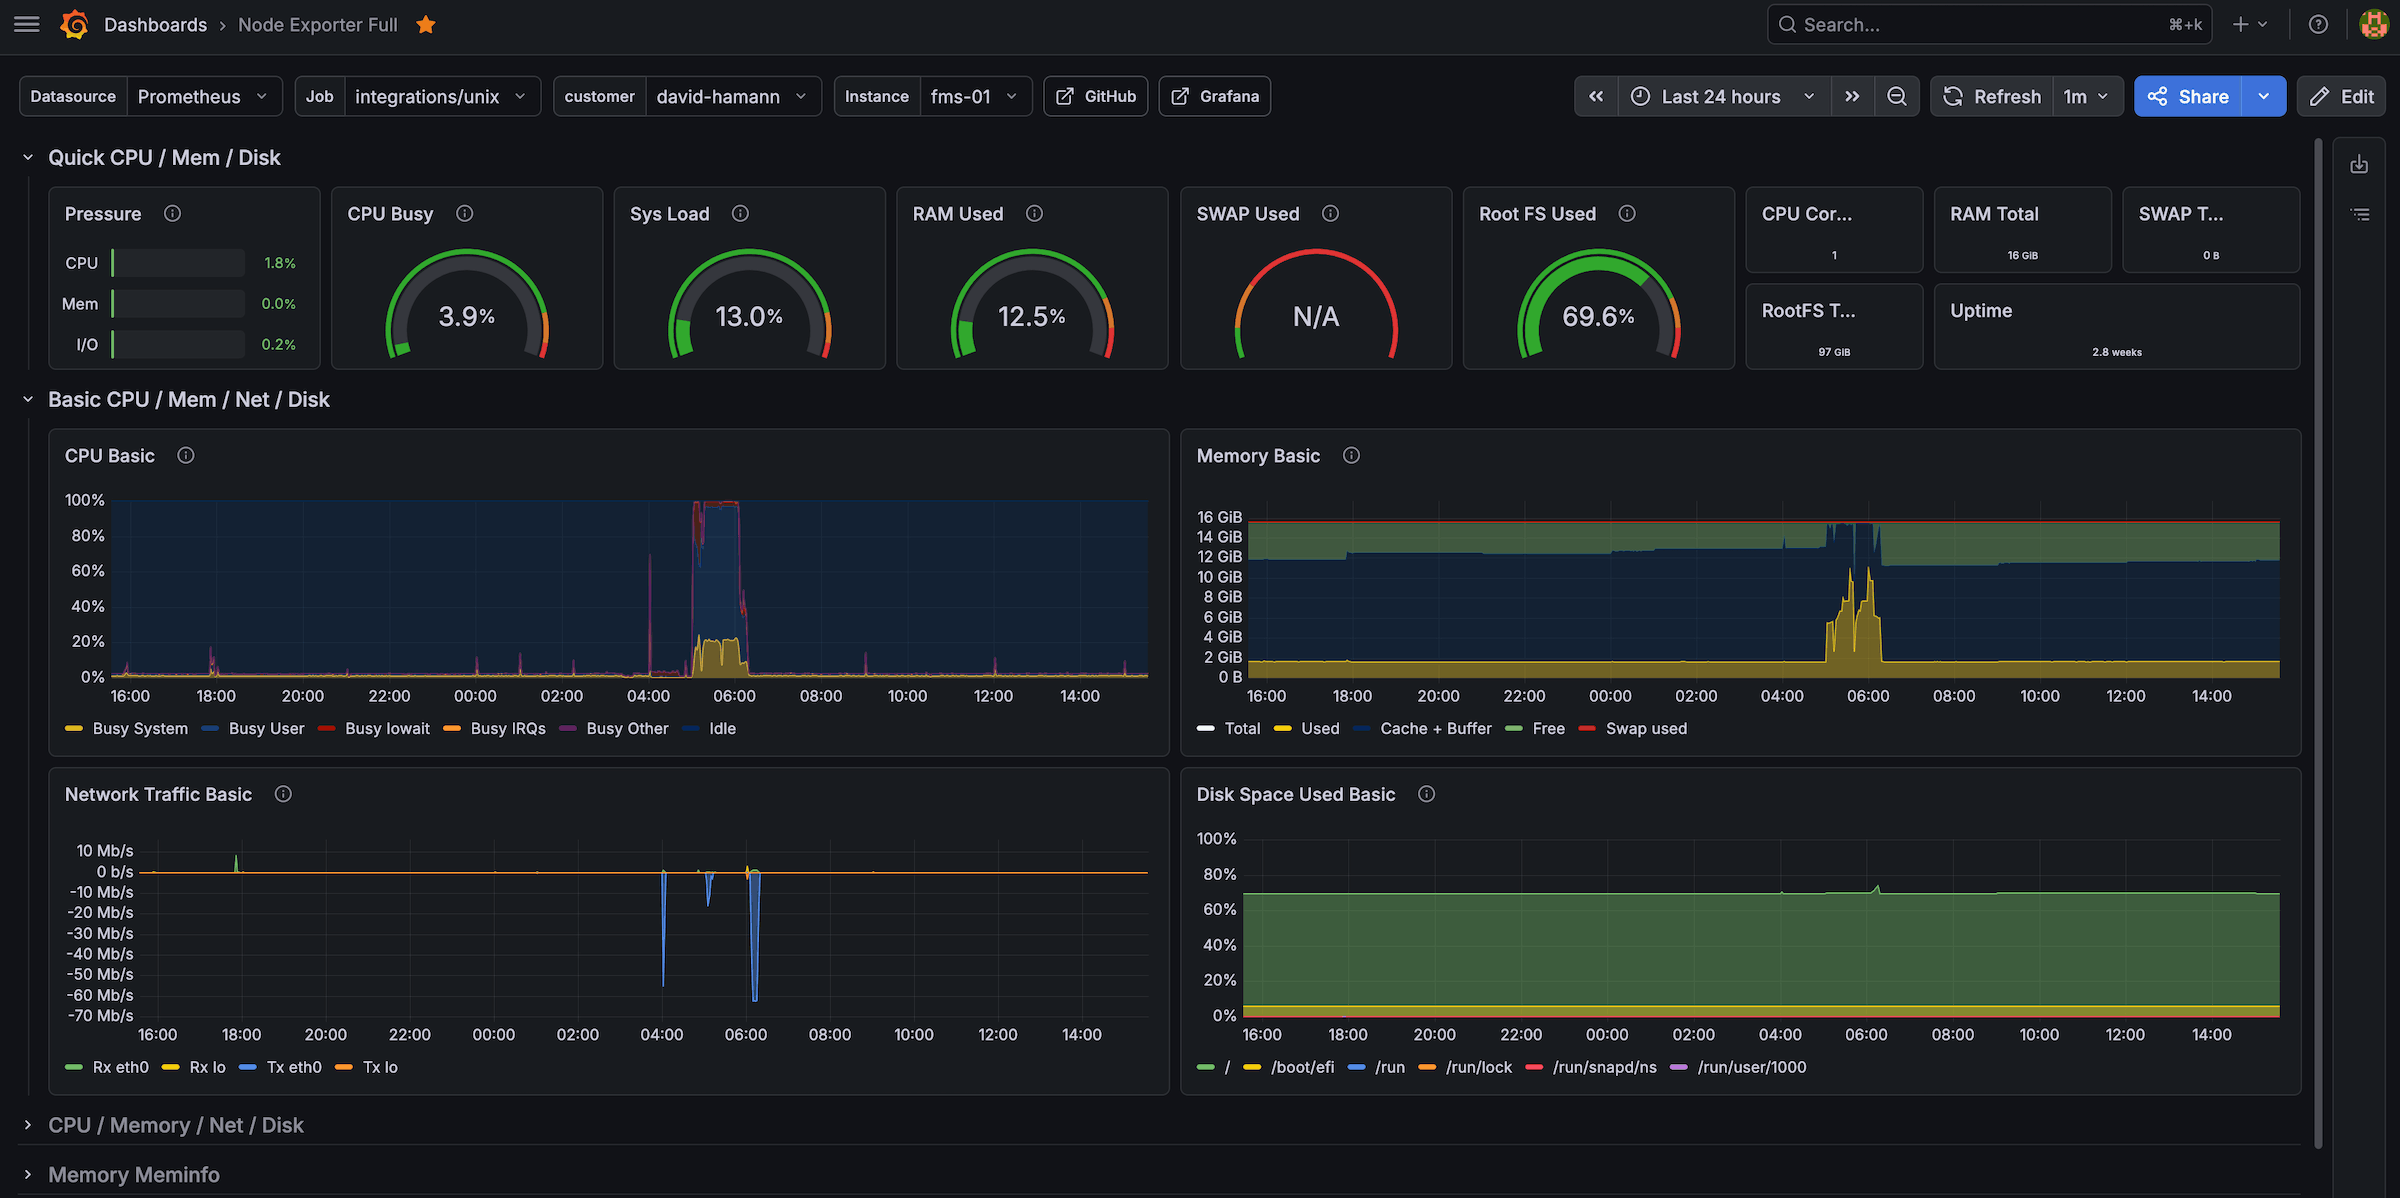
Node Exporter Full Dashboard for a host (easy filtering by customer/instance label):
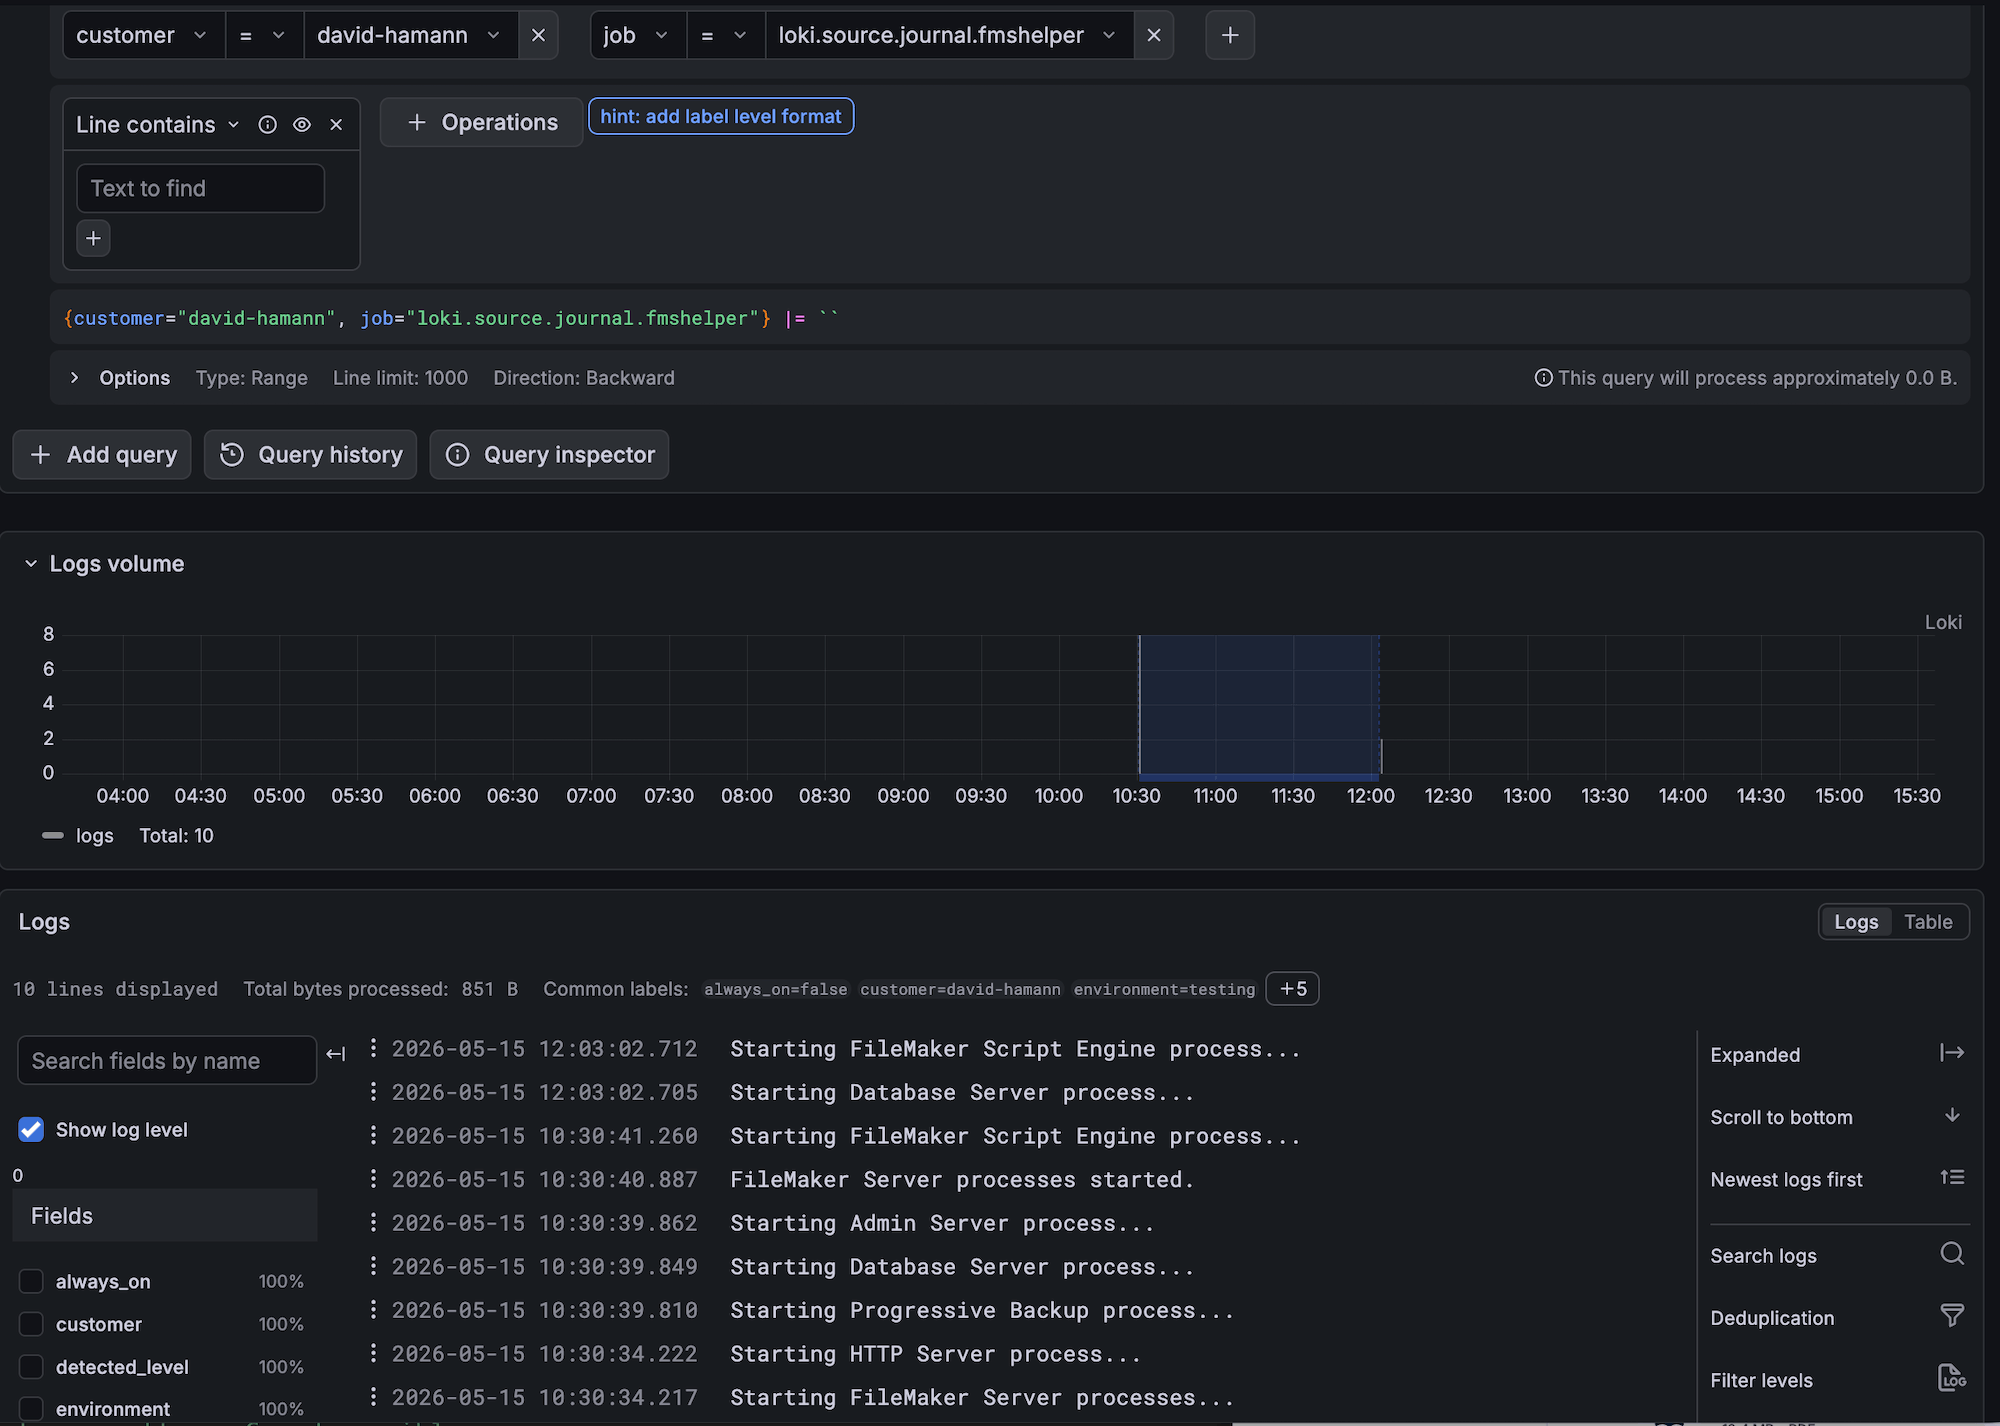
Exploring Loki logs in Grafana:
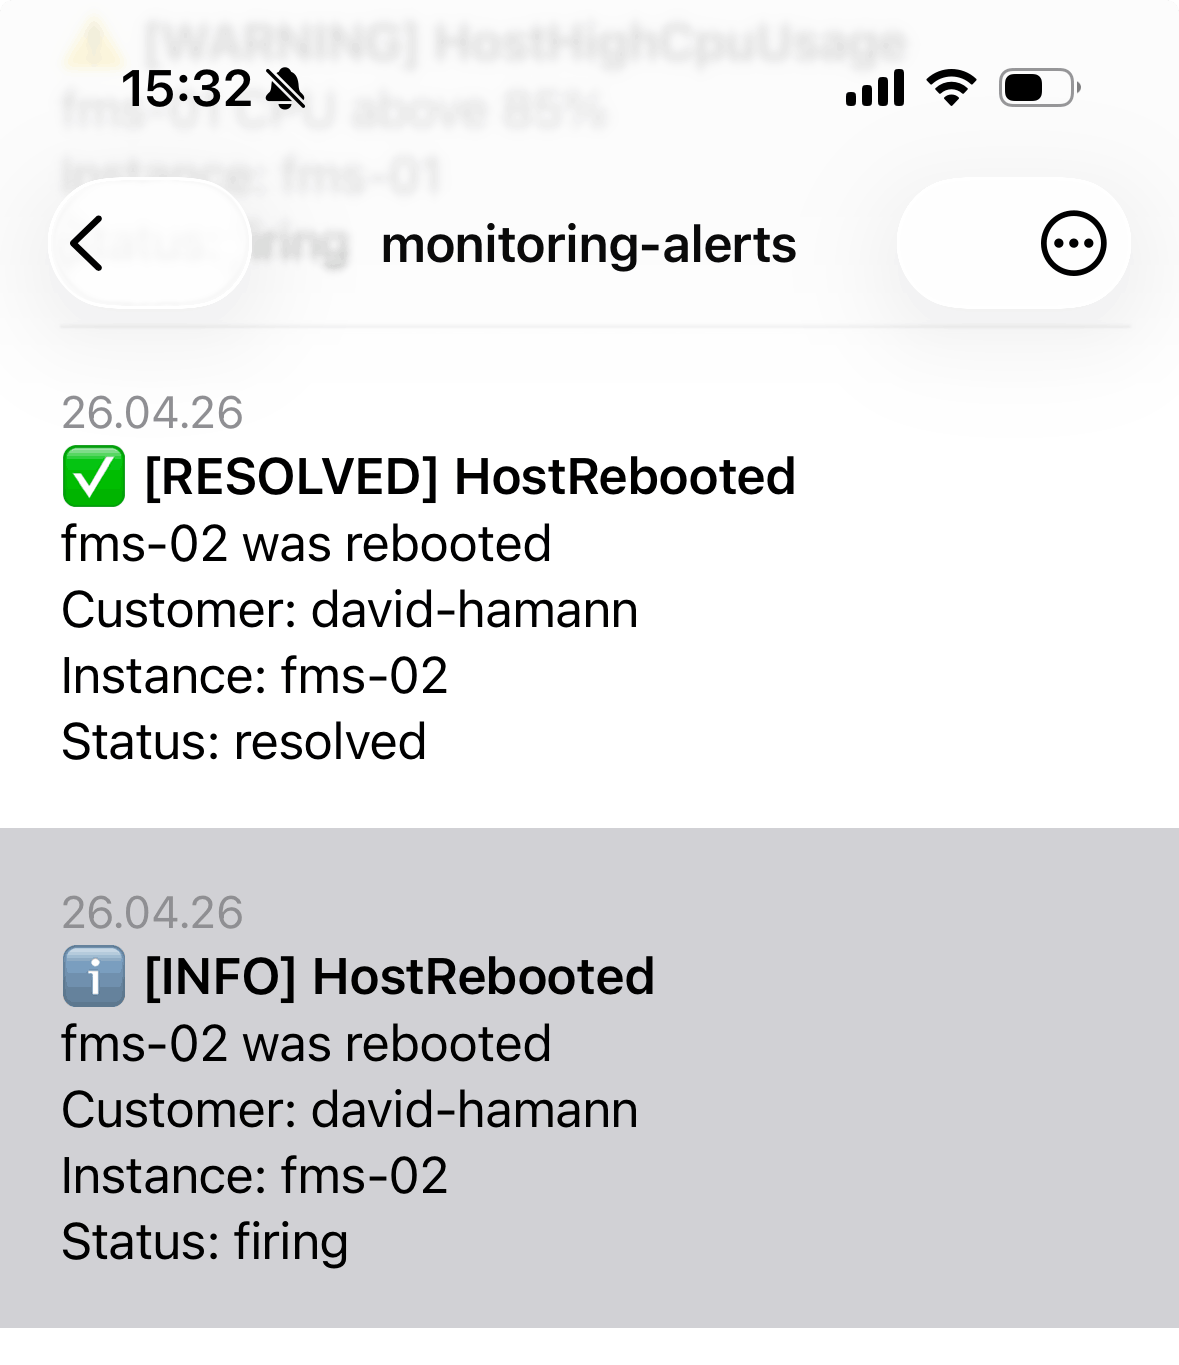
Getting alert notifications in the ntfy iOS app:
✉️ Have a comment? Please send me an email.