During the weekend, I discovered Bokeh, a Python visualization library for the web. The samples looked nice, so I played around a bit, mostly following the accessible Quick Start guide.
Eventually, I decided to build a small dashboard with Bokeh for an existing Flask application and wanted the plots to automatically fetch data updates using AJAX requests. This meant fiddling around a bit and reading more documentation. If you plan on doing something similar, the following write-up hopefully saves you some time and pitfalls.
What are we going to build?
With Bokeh you can build stand-alone and server-based data visualizations. The stand-alone visualizations are generated once in your Python environment and then saved to a file (or just delivered to a browser). The plots are then drawn and made interactive using BokehJS, the client-side JavaScript library, that needs to be included in your page.
If you want your visualizations to be based on large datasets, use streaming data, auto-downsamling for efficiency, and other goodness, you can use the Bokeh Server component.
For this tutorial I assume that you…
- Don’t want to run another server component (i.e. Bokeh Server)
- Have an existing Flask app that should do the processing / data delivery
- Nevertheless want to refresh your visualizations in short intervals using AJAX requests
Flask demo app
To simulate our exisiting application, we quickly install Flask into a virtual environment, and create a simple app.py.
virtualenv venv --python=`which python3`
source venv/bin/activate
pip install Flask bokeh
mkdir templates
touch app.py
export FLASK_APP=app.py
export FLASK_DEBUG=1
And our app.py contains for now:
from flask import Flask
app = Flask(__name__)

@app.route('/')
def index():
    return 'Hello World!'
Before continuing, let’s quickly check that our Flask app runs OK:
flask run
 * Serving Flask app "app"
 * Running on http://127.0.0.1:5000/ (Press CTRL+C to quit)
A simple plot
Let’s enrich our demo app by ouputting a simple, static plot. To set things up, we first create two template files for our page skeleton.
Add a layout.html to the templates folder and give it the following content:
<!DOCTYPE html>
<html lang="en">
  <head>
    <!-- Bokeh includes-->
    <link rel="stylesheet" href="http://cdn.pydata.org/bokeh/release/bokeh-0.12.13.min.css" type="text/css" />
    <script type="text/javascript" src="http://cdn.pydata.org/bokeh/release/bokeh-0.12.13.min.js"></script>
  </head>
  <body>
    <div>
        <h1>Bokeh sample</h1>
        {% block body %}{% endblock %}
    </div>
  </body>
</html>
Now add dashboard.html to the templates folder:
{% extends "layout.html" %}
{% block body %}
    {% for plot in plots %}
        {% for part in plot %}
            {{part | safe}}
        {% endfor %}
    {% endfor %}
{% endblock %}
The template files should look familiar to you if you have worked with Flask/Jinja before. In a nutshell: we have our base html skeleton (layout.html) and ourdashboard.html which extends the base. In dashboard.html we output all parts (we see that next) of all plots that are contained in the plots variable.
Time to start plotting: in app.py, add the following imports:
from flask import render_template
from bokeh.plotting import figure
from bokeh.embed import components
Finally, add the dashboard route and our first plot function:
@app.route('/dashboard/')
def show_dashboard():
plots = []
plots.append(make_plot())
return render_template('dashboard.html', plots=plots)
def make_plot():
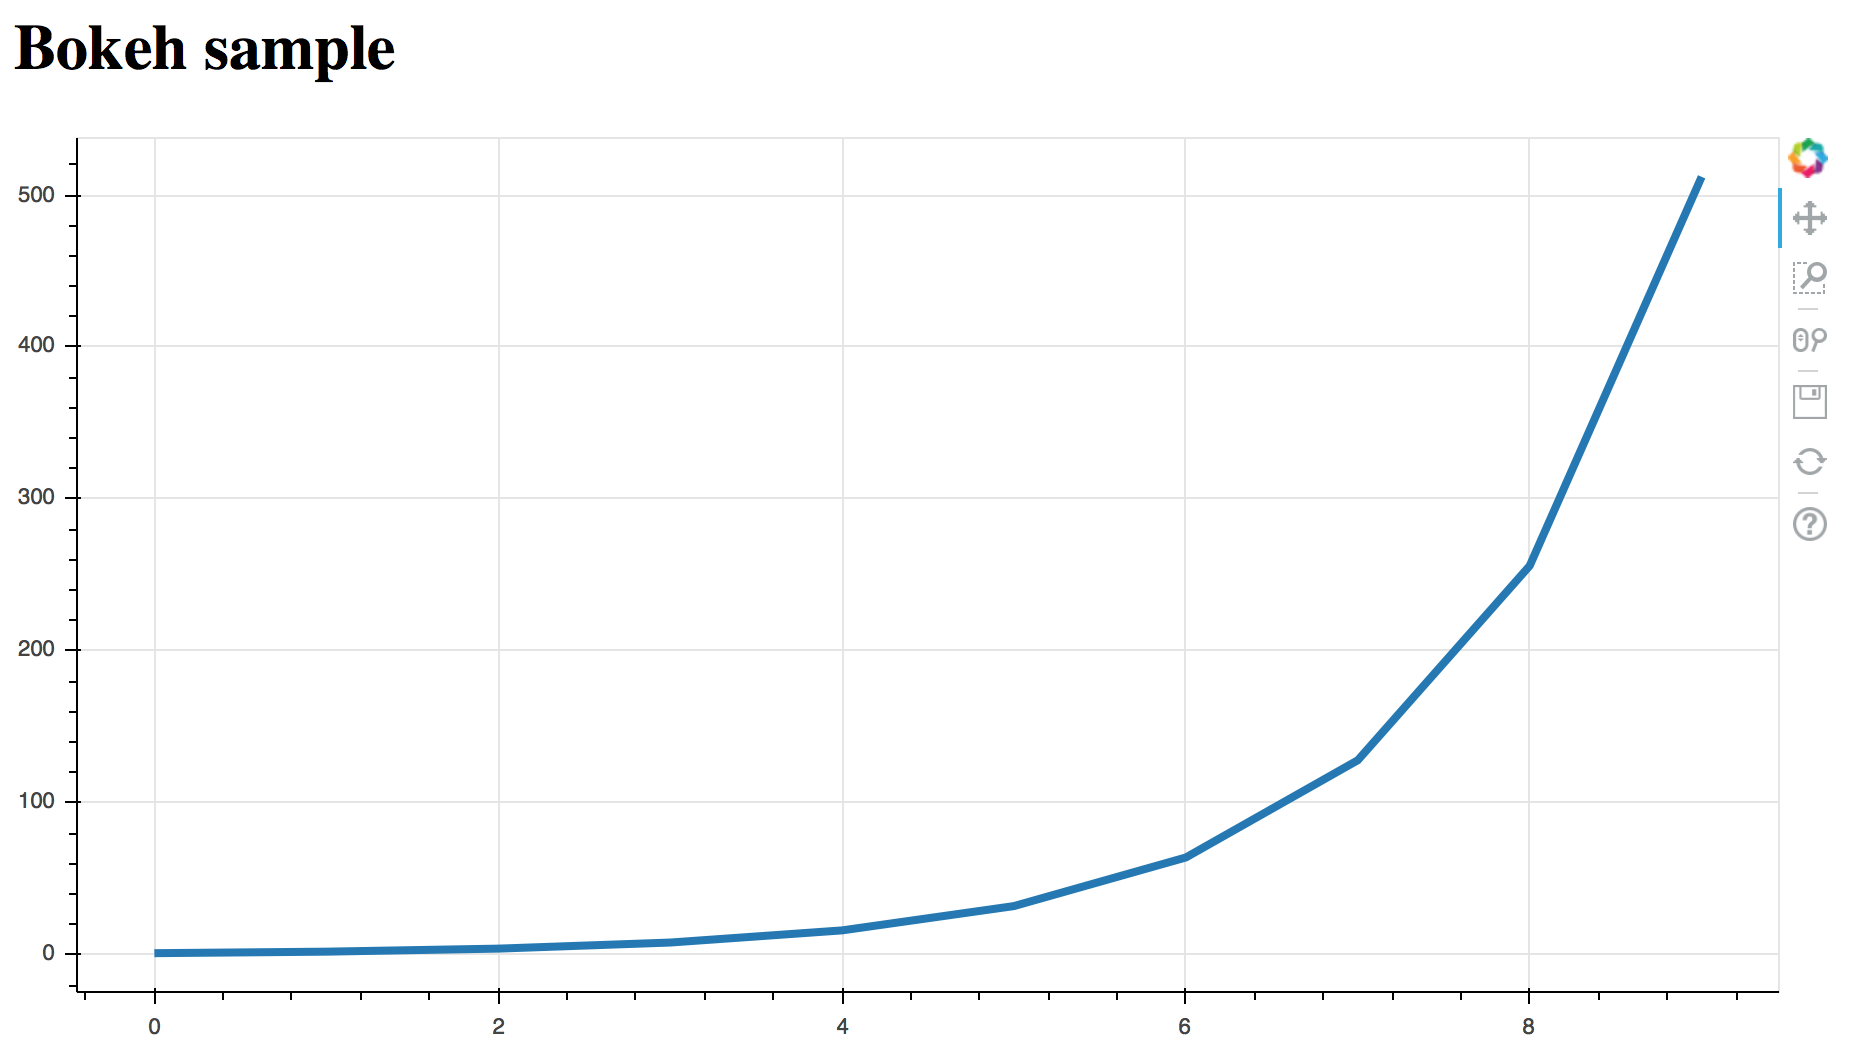
plot = figure(plot_height=300, sizing_mode='scale_width')
x = [0, 1, 2, 3, 4, 5, 6, 7, 8, 9]
y = [2**v for v in x]
plot.line(x, y, line_width=4)
script, div = components(plot)
return script, div
Going to http://127.0.0.1:5000/dashbord, we should now see the following plot:
What’s going on?
We imported figure and components from Bokeh. figure is used to create a plot (more precise: a Figure object) and takes arguments that apply to the whole plot. To keep things simple, we just gave the Figure object a height and a responsive width.
To create a line chart (or, in Bokeh terms: to add line glyphs), we then used the line method, passing in our prepared lists of x and y.
components conveniently prepares the HTML components to embed our plot into our site. We get both a script and a div tag, which we pass on to our previously defined template (see render_template() and dashboard.html).
Without much effort, we now have an interactive plot embedded in our web app. Cool!
There are various ways to style the plot further, control what widgets are shown, etc., but we leave it here, and focus on the next step: make it refresh automatically.
Refreshing the plot with new data
For refreshing our plot via an AJAX request we have two options: either we replace the whole data for the plot with the data returned by our web app, or we only deliver data updates and then append this data to the plot.
Since we don’t have any data store to pull new data from in this tutorial, we will continuously generate data for our exponential curve like above and append it to our plot. To keep track of where we are, we simply keep the state of x in a global variable.
x when you are working with your real web app 🙃. Depending on what you are doing, you may also want to keep track of different states and not just one global state until the app is restarted. If your dataset is not too large, you might as well be fine with the replace option.In app.py we first add a few more imports. We need jsonify and request from Flask to format our data output and get our url. And we need AjaxDataSource from Bokeh, to tell the plot that we have a http data source.
from flask import Flask, render_template, jsonify, request
from bokeh.models.sources import AjaxDataSource
Next we create our new plotting function in app.py:
def make_ajax_plot():
    source = AjaxDataSource(data_url=request.url_root + 'data/',
                            polling_interval=2000, mode='append')

    source.data = dict(x=[], y=[])

    plot = figure(plot_height=300, sizing_mode='scale_width')
    plot.line('x', 'y', source=source, line_width=4)

    script, div = components(plot)
    return script, div
Compared to the first make_plot() we only have a few changes: instead of passing our data series directly to the line method, we now pass our previously generated AjaxDataSource object as source argument. x and y here refer to the “columns” in the AjaxDataSource.
AjaxDataSource takes as argument the address of our new data route, accessible via http://127.0.0.1:5000/data/ (see below), to fetch the new x,y values. We additionally set the update interval to 2 seconds, and choose the append mode (the other option would be replace, see above).
To generate and deliver our continuous data updates, we add the /data/ route to our app.py:
x = 0
@app.route('/data/', methods=['POST'])
def data():
    global x
    x += 1
    y = 2**x
    return jsonify(x=x, y=y)
Note that we are not regenerating the whole components for every update. We only deliver json formatted data, one (x, y) pair at a time.
Finally, let’s add the second plot to our dashboard:
plots.append(make_ajax_plot())
Tadaa!
Opening our dashboard should now give us a plot, that “grows” every two seconds by appending fresh data retrieved from our Flask app:
If you are having trouble reproducing the result, check out the GitHub repo with the final state.
✉️ Have a comment? Please send me an email.