When you want to debug an application in an environment which is hard to replicate locally and/or you cannot install additional software on the machine it is running on, remotely connecting a debugger might be a good option to find out what’s going (wr)on(g).
Let’s have a look how we can remote debug a NodeJS application. I will use VSCodium as the debugging client, but there are certainly other options that work equally fine (you could even use the built-in minimal debugger with node inspect host:port).
Setting up the remote app
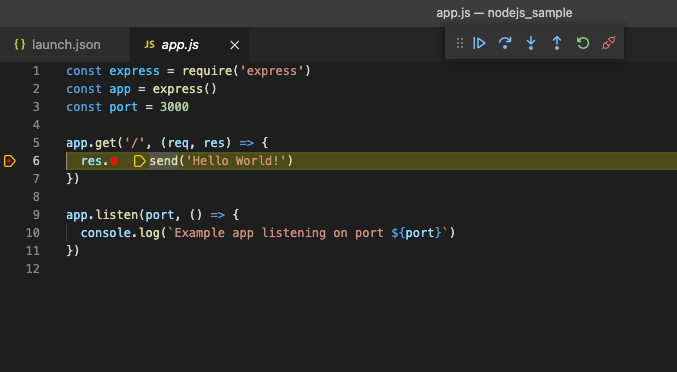
Let’s say we have the following minimal web application on our remote machine.
app.js:
const express = require('express')
const app = express()
const port = 3000

app.get('/', (req, res) => {
  res.send('Hello World!')
})

app.listen(port, () => {
  console.log(`Example app listening on port ${port}`)
})
In normal scenarios we can run the application with node app.js and it’ll start accepting requests on port 3000.
But NodeJS makes it easy to also launch a debugging endpoint, so-called Inspector, along with application:
node --inspect=1.2.3.4:9229 app.js
The above command will bind the Inspector service to the IP 1.2.3.4 and port 9229. Replace 1.2.3.4 with whatever interface you later want to connect to.
Once the Inspector is running we need one more detail to connect to it: the UUID which is assigned when the process starts and which needs to be known to the connecting client.
If you don’t see it in the output when starting your app, you can connect to the following endpoint (on the interface you specified with --inspect) to discover it:
$ curl http://127.0.0.1:9229/json/list

[ {
  ...
  "id": "618339fa-2a18-4fea-b1f5-c20522e17a2b",
  "title": "app.js",
  "type": "node",
  "webSocketDebuggerUrl": "ws://127.0.0.1:9229/618339fa-2a18-4fea-b1f5-c20522e17a2b"
} ]
Setting up the local debugger
Back at our local machine we have three requirements:
- We need a debugging client (I’m using VSCodium)
- We need a copy of the source code of the application to debug
- We need the address and UUID of the Inspector running on the remote machine
Let’s start by opening the folder with the source code (in this example with only the app.js file in it) in VSCodium.
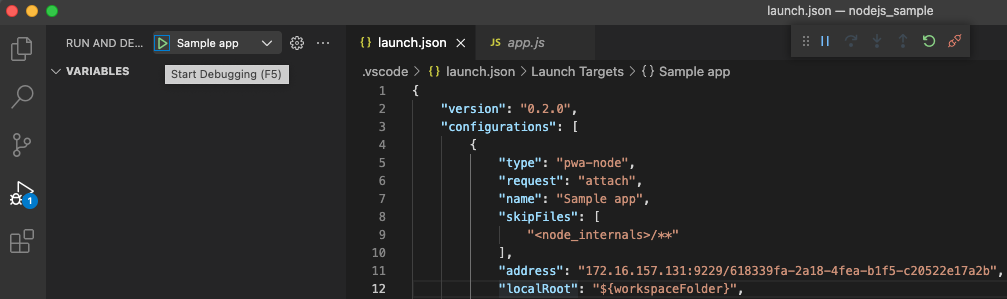
Next, we create a “launch configuration” so that our debugger knows where and how to connect.
By default, the configuration will sit in .vscode/launch.json. For our sample app we use the following contents:
{
    "version": "0.2.0",
    "configurations": [
        {
            "type": "pwa-node",
            "request": "attach",
            "name": "Sample app",
            "skipFiles": [
                "<node_internals>/**"
            ],
            "address": "1.2.3.4:9229/618339fa-2a18-4fea-b1f5-c20522e17a2b",
            "localRoot": "${workspaceFolder}",
            "remoteRoot": "/path/on/remote/machine/",
        }
    ]
}
Essentially, we are saying that we want to attach to an existing process, define the address of the remote machine (including UUID), and point to the directories where the code resides locally and remotely.
Make sure to adjust the values for the keys address and remoteRoot to fit your setup.
Start debugging
With the launch configuration in place we can connect to the remote process by clicking on the “Run and Debug” button or just press F5.
With the client connected to the remote process, we can start setting breakpoints in the code, send a request (e.g. curl http://1.2.3.4:3000/) and then (as usual) use the debugger to inspect variables, step through the code, etc.:
✉️ Have a comment? Please send me an email.