When debugging code that integrates with the Claris FileMaker Data API, it is sometimes helpful to trace a request from your app all the way to the code of the Data API. You might be getting an unexpected error response, want to see what data actually arrives on the server, how a wrapper library, if you use any, might translate the request/response, etc.
Doing this kind of troubleshooting is much easier when you are able to directly attach a debugger to the remote process. This blog post describes a few steps you can take to remotely debug Data API requests.
Preparing the start script
The first thing we want to do on the FileMaker Server is to stop the Data API with fmsadmin stop fmdapi.
Next, we need to do a slight modification in a shell script responsible for starting the Data API. Remember from the above linked blog post that we want to start the Inspector service along with the target NodeJS app. The place where this happens is in /Library/FileMaker Server/Web Publishing/publishing-engine/node-wip/wipdeploy.sh:
# [...]

    INSTALL_ROOT="/Library/FileMaker Server"
    WIPNODE_PATH="$INSTALL_ROOT/node"
    NODE_PATH="${WIPNODE_PATH}/bin/node"

# [...]

WIP_NODE_DIR="$INSTALL_ROOT/Web Publishing/publishing-engine/node-wip"
WIP_NODEJS="$WIP_NODE_DIR/app.js"

# [...]

if [ "$1" = "start" ] ; then
  echo "Starting WIP node"
  shift

  if [ "$1" = "-p" ]; then
    shift
    WIPNODE_BASE=$1
  fi

  echo "Execute node JS $NODE_PATH $WIP_NODEJS"
  "$NODE_PATH" "$WIP_NODEJS" "-$WIP_COMP"
As you see in the script, a couple of variables are set to define the install location and app file. Eventually, these variables make up the command to launch the Data API.
To tell NodeJS that we want to have a debugging endpoint listening we can add our extra argument --inspect (make sure to set the IP for your environment):
"$NODE_PATH" --inspect=172.16.157.133:9229 "$WIP_NODEJS" "-$WIP_COMP"
With this change in place (save your changes!) we can launch the Data API again, just like we normally would: fmsadmin start fmdapi.
Preparing our local environment
As described in the first blog post we need to have a copy of the source code of the remote app on our local machine as well. We can get this copy of the Data API NodeJS app from /Library/FileMaker Server/Web Publishing/publishing-engine/node-wip.
Opening the code with VSCodium on our local machine, the only thing left to do is to create a .vscode/launch.json configuration file and set the IP address of the FileMaker Server/Data API host and the assigned UUID:
{
    "version": "0.2.0",
    "configurations": [
        {
            "request": "attach",
            "name": "FMS Data API Debugging",
            "skipFiles": [
                "<node_internals>/**"
            ],
            "address": "172.16.157.133:9229/18de71ea-bc0a-4a15-8886-e3c1d24b8e72",
            "localRoot": "${workspaceFolder}",
            "remoteRoot": "/Library/FileMaker Server/Web Publishing/publishing-engine/node-wip/",
            "type": "pwa-node"
        }
    ]
}
The above config is the same as described in the first blog post. I obtained the UUID via curl http://172.16.157.133:9229/json/list.
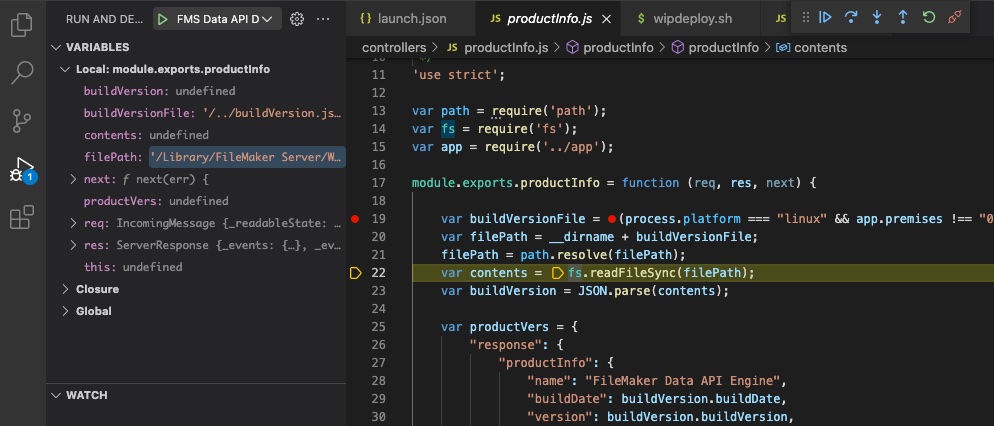
Start debugging
Now that we have all things in place we can start the debugger in VSCodium and it should connect and attach to the Data API app on the remote host:
Two caveats
There are two additional things worth noting in this setup:
- Please be aware of the warning in the first article regarding remote code execution, i.e. make sure to have a trusted environment and secure connection to your debugging endpoint.
- While this setup gets you quite far in helping to understand what data arrives at the Data API application, what the expected format of the requests are, error messages being generated, behaviours not being described in the documentation, etc., it is much harder to analyse what happens as soon as the Data API makes a request to the database server via Thrift (as the database server source is obviously not open). Nevertheless, often times tracing the request until it is directed to Thrift will already aid you in identifying potential issues.
✉️ Have a comment? Please send me an email.